![]()
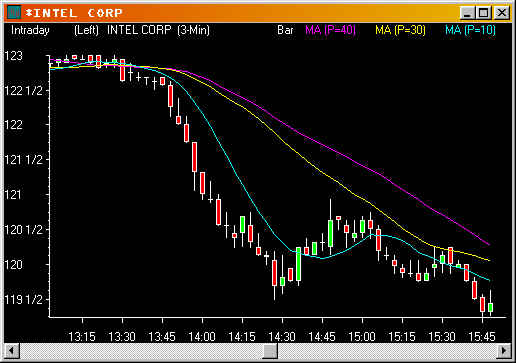
The candlestick chart above has 3 moving averages. A moving
average is a series of points that form a line. Each point is
calculated by averaging the prices within a selected time period
and connecting with a line. Our exclusive![]() training
program will teach how to create moving averages, the various
types (simple, exponential, etc.), and how they are used to keep
your trade in a winning trend, so you don't exit the trade too
soon and "leave money on the table". Moving averages
are also used as an indicator for entry points.
training
program will teach how to create moving averages, the various
types (simple, exponential, etc.), and how they are used to keep
your trade in a winning trend, so you don't exit the trade too
soon and "leave money on the table". Moving averages
are also used as an indicator for entry points.
The![]() program
makes learning easy and efficient. Unlike seminars or hours of
lecture,
program
makes learning easy and efficient. Unlike seminars or hours of
lecture,![]() gives
you visuals to help you remember and the ability to review when
it fits your schedule.
gives
you visuals to help you remember and the ability to review when
it fits your schedule.