![]()
The Princeton![]() training
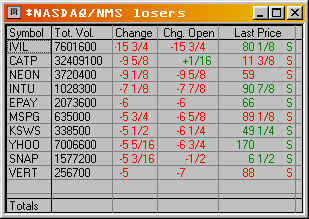
program makes learning fast and easy. Our computer recorded real
time movies will show you how to create the "losers"
chart. Approximately each minute this chart refreshes as it looks
for stocks that have the largest price loss. The top 10 list of
losers is updated automatically with the stocks that are losing
the most money.
training
program makes learning fast and easy. Our computer recorded real
time movies will show you how to create the "losers"
chart. Approximately each minute this chart refreshes as it looks
for stocks that have the largest price loss. The top 10 list of
losers is updated automatically with the stocks that are losing
the most money.
Princeton's![]() training
programs incorporate "pause and create" capability.
As the training video is showing you the steps to create this
or any other chart, you can pause the training video and create
part of the chart in Realtick 7, then continue the video. Start
and stop as many times as you need to.
training
programs incorporate "pause and create" capability.
As the training video is showing you the steps to create this
or any other chart, you can pause the training video and create
part of the chart in Realtick 7, then continue the video. Start
and stop as many times as you need to.