![]()
Candlestick charts are used to predict where a price might
be going based upon where it has been and what it is doing at
the present. Our exclusive![]() training
program will teach you the parts of the candlestick, what the
different sizes mean and the various TREND REVERSAL PATTERNS.
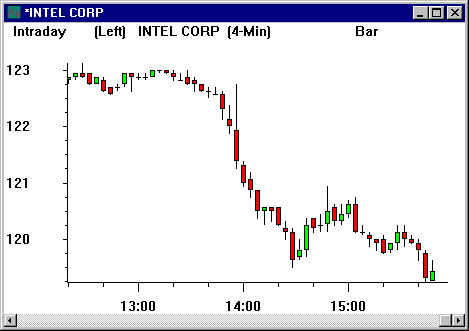
In the chart above, a "hanging man" and an "evening
star" foretold about this reversal of over 3 points. Selling
the stock short (we will make sure you understand the short selling
concept) could have netted over $3000.00 on a 1000 share trade
in about 1.5 hours.
training
program will teach you the parts of the candlestick, what the
different sizes mean and the various TREND REVERSAL PATTERNS.
In the chart above, a "hanging man" and an "evening
star" foretold about this reversal of over 3 points. Selling
the stock short (we will make sure you understand the short selling
concept) could have netted over $3000.00 on a 1000 share trade
in about 1.5 hours.
The![]() gives
you the ability to review your learning. Use it over and over
again to make the concepts second hand knowledge.
gives
you the ability to review your learning. Use it over and over
again to make the concepts second hand knowledge.